Profiler
I assume that you know what a profiler is, but for the sake of order I will state: Profiler tool (in the case of PHP Jet an integrated subsystem) that allows you to analyze the running of the application and find out how long which part of the application is executed, how much memory it takes up, how many and which SQL queries it executes and also what function (or class and method) how often it calls.
For an online application, especially if it is something exposed, for example an e-shop, an information system, a social network, a large portal, etc., information about the running of the application is essential - together with security, it is actually an absolutely key thing (I consider functionality and usability as matter of course). And for that reason, the profiler is directly integrated in PHP Jet . And I will state straight away that this integrated profiler may (but may not) work with XHProf .
The definition shows what the profiler is supposed to be able to do, but let's recap what the integrated one can do:
- It can divide the application into blocks - that is, it is possible to analyze the application in parts and better search for and solve problems. You can define the runtime blocks yourself, but with full use of MVC , the system does this to a large extent automatically.
- It will tell you how long the application ran (how long the request was processed), how much memory the application consumed, what SQL queries it executed and how much time it took. But above all, it will show all this not only overall, but also by blocks - as already mentioned. Then it is easier to find what can rub where.
- If you install XHProf, Jet Profiler will show you a beautiful call graph, which shows what (what function / method) is called most often and where the bottleneck of the application may be
Please also see how you can turn on the profiler and influence its behavior. Then we will explain the output in detail. And last but not least, we will show you how to make more use of the profiler and create your own blocks.
But if you want, first a little test:

This is the strip that appears at the bottom of the pages when the Profiler is active (by the way, you can also customize it as needed)

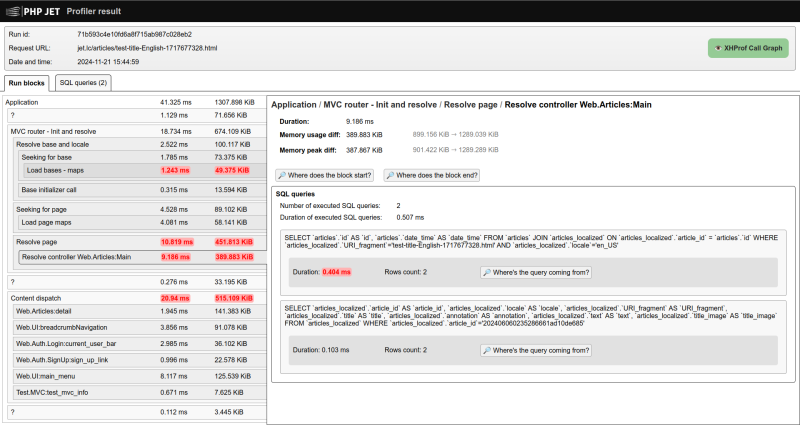
This is part of the full profiler output. Several runtime blocks of the website you are currently reading (no cache enabled).

And if you have XHProf , then you can easily view such call summary.

